
Retirement Curves and Risk Tolerance
Retirees have 3 basic choices when it comes to Retirement Portfolio construction. Each choice comes with Pros and Cons.
Aseem Sharma
6/17/20247 min read
Breaking down Retirement Finances into individual ingredients and understanding their properties may help one prepare the right recipie suited to their palatte.
Lets start with listing the ingredients
Corpus. All the investments one holds. Be it Equity, Debt, PPF, FDs, Savings ac balance, MF, Gold, Crypto, Real Estate (except the house one lives in).
Rate of Return / Return on Investment (ROI) from each of the holdings above. For assets that have variable returns such as Equities, refer to last 5 year’s annualised return.
Inflation. If we look back for guidance, we see that annualised inflation over the last 34 years (since 1990) is around 7%.
Expenses. Add up annual expenses and group them under Mandatory (electricity bills, taxes, society charges, etc.), Essential (grocery, internet bills, health insurance, fuel, phone bills etc.) and Discretionary( vacations, dining out, shopping etc)
Time. That’s tricky. one may put a number there based on your personal health and family history. Please don’t use 70 years just because that’s what life expectancy at birth in India is. Its misleading and I’ll discuss that in another post
Variability of Returns (Volatility). Volatility becomes a factor if we choose to invest part of our Retirement Corpus in Equities, Gold and Bonds. Its significance depends on the proportion of these instruments in our investments. For the present discussion we will keep volatility in abeyance. Let's build the models first. We can overlay volatility in future posts.
Now that we assembled all the ingredients, lets go over the choices available to deploy the corpus
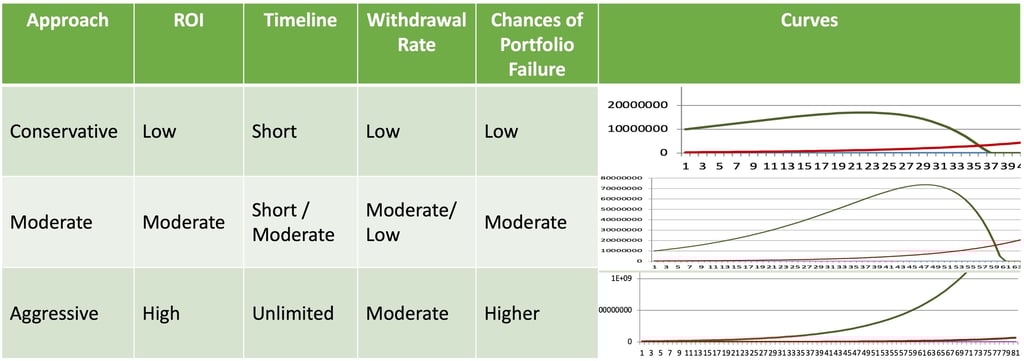
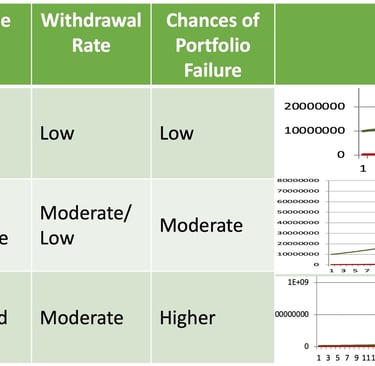
Curve 1 Conservative Plan - Do you prefer 100% surety for your cashflows year after year, or are you okay with variability? If you are someone who likes to be doubly sure of your cashflows, then you are a conservative investor. You may want to choose low risk or risk free instruments as your investment vehicle of choice(such as long term treasury bonds, FD, PF etc.). This way you’ll have great surety of returns and cashflows. The returns themselves will likely stay close to inflation as these are risk free investments. For such investments, your financial retirement curve will look like Fig. 1. with the assumption that your returns match inflation (7%). You may notice that the corpus(Fig.1Observe the green line) keeps growing in the initial years despite you taking out part of it to meet your expenses every year. It starts at Rs. 1Cr and keeps increasing year after year even as you keep withdrawing every year adjusted to inflation. But don’t be fooled by it. As you get closer to the end of your planned timeline, the corpus maxes out around 2/3 rd of the way. That’s the year your expenses exceed your annual returns. From that year onwards, the decline in the corpus is swift and steep. So, be sure you choose the timeline well, giving yourself enough room. No one wants to spend the last years fretting about money. The long and short of a conservative plan is that, While there is great surety around the cashflows during the planned timeline, there is equal surety that they will dry up at the end of the projected timeline.
For Fig. 1
Corpus ₹1 Cr. (Y axis)
Time Post Retirement 35 years (X axis)
ROI 7%
Inflation 7%
Withdrawal Rate ₹3 lac per year/ ₹25,000 per month or 3% of corpus in the first year
Green Line Corpus
Red Line Expenses
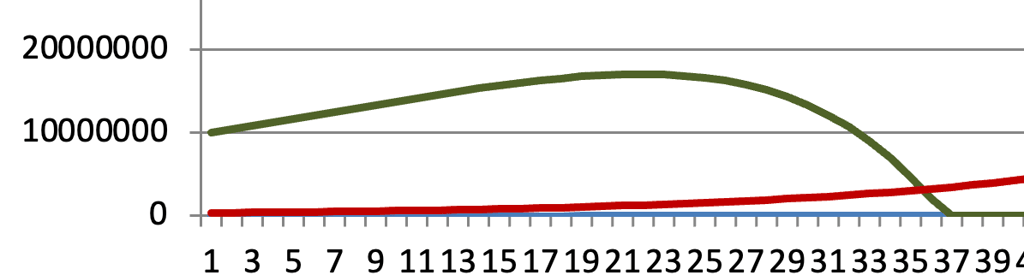
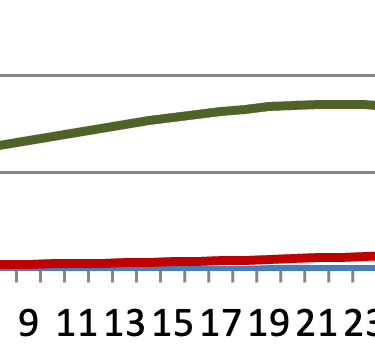
Fig. 1 Conservative
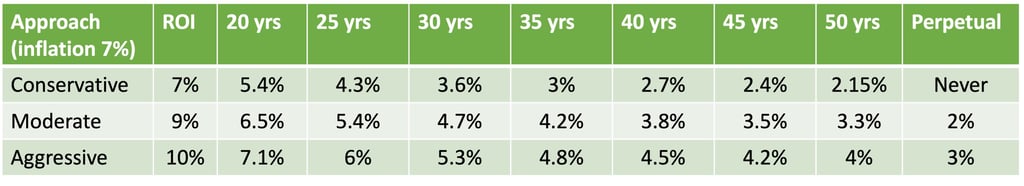
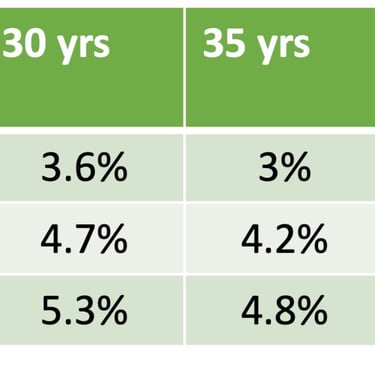
For a 35 year timeline, the withdrawal rate is 3% of the corpus(first year) that is 3 lacs a year or Rs. 25,000 a month for a corpus of 1 Cr, which gets adjusted to inflation every year. Similarly, for a 30 year period, the withdrawal rate would go up to 3.6%, for 25 years 4.3% while for 40 years it comes down to 2.7%.
Curve 2 Moderate - If one has invested in direct equity or equity Mutual Funds during the working years they know that returns can vary year on year but over the long term these instruments deliver returns higher than FD and PF and Inflation. Based on the risk tolerance, retirees may choose to invest part of their corpus in such instruments.
Figure 2a. Takes the same corpus of ₹ 1Cr and increases the ROI to 9%, couple of percentage points above inflation. Observe that just 2% additional return can stretch your timeline by 25 years (from 35 to 60).
For Fig. 2a
Corpus ₹1 Cr. (Y axis)
Time Post Retirement 60 years (X axis)
ROI 9%
Inflation 7%
Withdrawal Rate ₹3 lac per year/ ₹25,000 per month or 3% of corpus in the first year
Green Line Corpus
Red Line Expenses
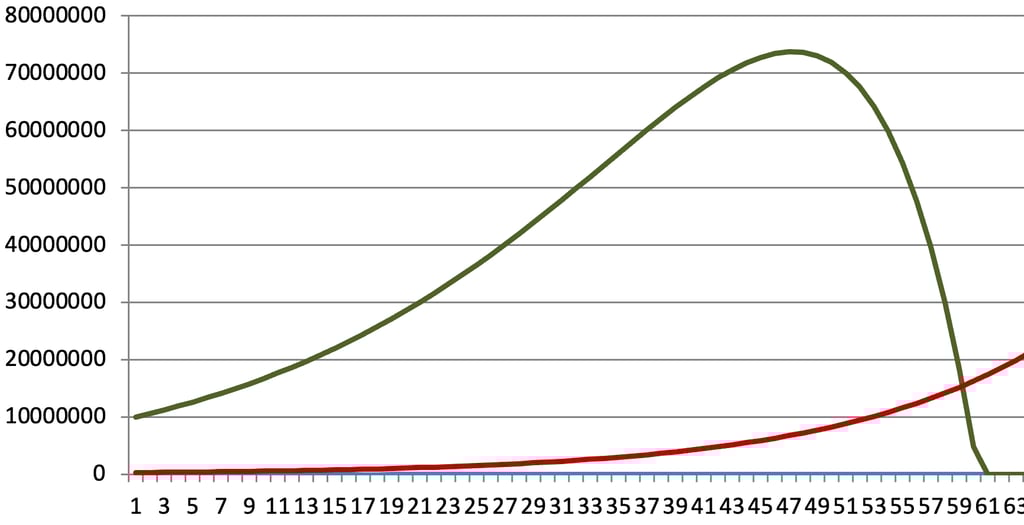
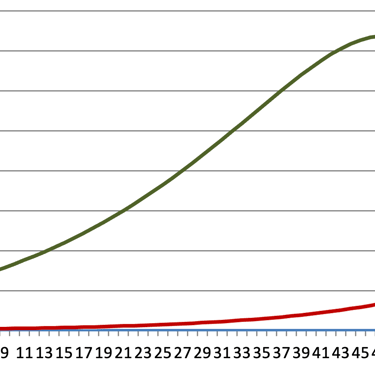
Fig. 2a Moderate with longer timeline
There is another way to derive the benefit of higher ROI. For the same corpus of ₹1Cr. and the timeline of 35 years, one may now be able to withdraw ₹4 lac a year an increase of ₹1 lac every year, improving quality of life. This is shown below in Fig. 2b
Increased ROI has Costs
It’s important to understand though that adding any amount of equity, gold or bonds may add variability to the returns. Consequently, the curve may not be as smooth as the one shown here. The returns may exceed 9% in some years and will clock lower than 9% in others. Moving a small part of your portfolio to equities for higher ROI that is couple of percentage points above inflation will keep volatility low, avoiding wild swings like the ones we saw impacting equity markets during covid times. But always remember that there is no free lunch. Adding equity to the mix while increasing ROI also introduces the risk of Portfolio Failure.
Portfolio Failure
Portfolio Failure happens when your corpus runs out before the projected timeline due to any of the ingredients going awry. In the present case even if other parameters such as inflation and withdrawals stay as projected, variability of ROI can cause the corpus to run out before projected time. Comparing to Option 1 where there was little risk of Portfolio Failure, Option 2 has a finite risk of Portfolio Failure the moment we add instruments with variability of returns. Trying to increase ROI through equity, gold or bonds makes you susceptible to the risk of Portfolio Failure.
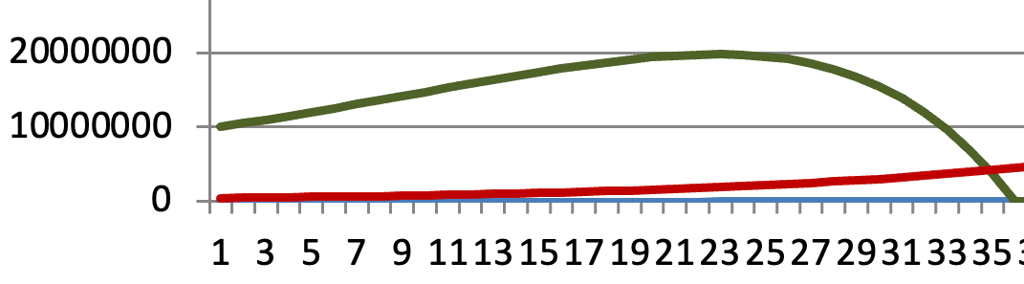
Fig. 2b Moderate with higher withdrawal
Corpus ₹1 Cr.
ROI 9%
Inflation 7%
Withdrawal Rate ₹4 lac per year/ ₹35,000 per month or 4% of the corpus in the first year
Time 35 years
Green Line Corpus
Red Line Expenses
Option 3 - Perpetual Corpus: Looking at Option 2 one may wonder, what if the ROI goes up by more, let’s say instead of 9% we can get up to 10-12%. What would happen then? Is there an inflection point? What’s that magic number and what happens if we go beyond? The short answer is “Yes”, there is a magic ROI number beyond which the corpus never touches zero, not in 50, 100 or even 1000 years that is if inflation and withdrawals projections stay on course.
How to calculate this number? It’s a rather simple calculation, if the ROI exceeds sum of inflation and withdrawal rate then the corpus will last for ever.
ROI > Inflation + Withdrawal Rate
As an example in Option 1, the inflation is at 7% and the withdrawal rate is 3% of the corpus. If the ROI exceeds 7 + 3 = 10% then the corpus would last for ever.
Fig. 3 refers to such a condition. Note that the Green line (Corpus) swings up and never comes down.
This surely is the dream outcome but it comes with strings attached. Just like in Option 2, there is a risk of Portfolio Failure along the way. We are pushing the ROI above 10% in this case, which means higher mix of equity, gold, crypto, which in turn could lead to higher risk of Portfolio Failure. On the brighter side the Retiree will never have to worry about money again. Even better, one would will leave behind a legacy larger than at the beginning of Retirement.
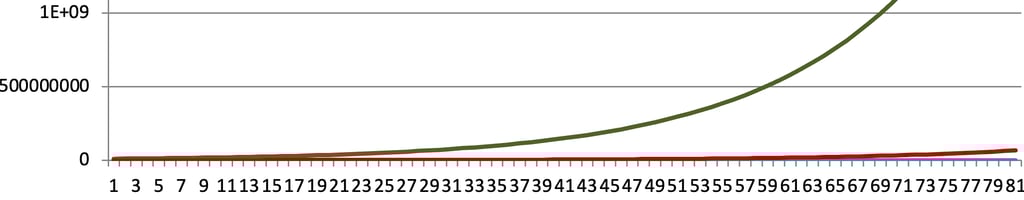
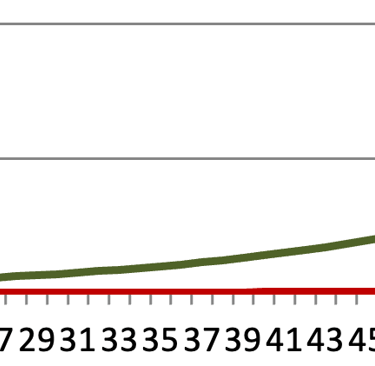
Fig. 3 Perpetual Corpus
Each Retirees may choose differently between any of these. Remember, we discussed keeping Mr. Compounding on our team in this post. Option 3 is what puts Mr. Compounding back on our team.
As a ready reckoner, I'm putting down the withdrawal rates based on the three approaches and the planned time period. Remember the equation for perpetual corpus?
A corollary to the equation is that if you can bring your withdrawal rate down to the difference between ROI and Inflation, you'll get the perpetual corpus rate. In the table below, you will notice that even for a moderate 9% ROI we can get perpetual corpus only if we reduced our withdrawal rate to 9%(ROI) - Inflation(7%) = 2%.
Just one more corollary before we conclude. If your ROI is equal to or less than inflation, you will run out of money eventually however big your corpus may be and however low your withdrawal rate.
Disclaimer : I'm NOT a SEBI Registered Investment Advisor or Analyst. All content on this website is for educational purpose only. Consult your financial advisor before making any financial decision including investing.