
1990-2024 Sensex vs Gold vs PPF - II
Optimal Asset Allocation and Max Withdrawal Rates possible for various retirement timeframes
Aseem Sharma
6/30/20243 min read
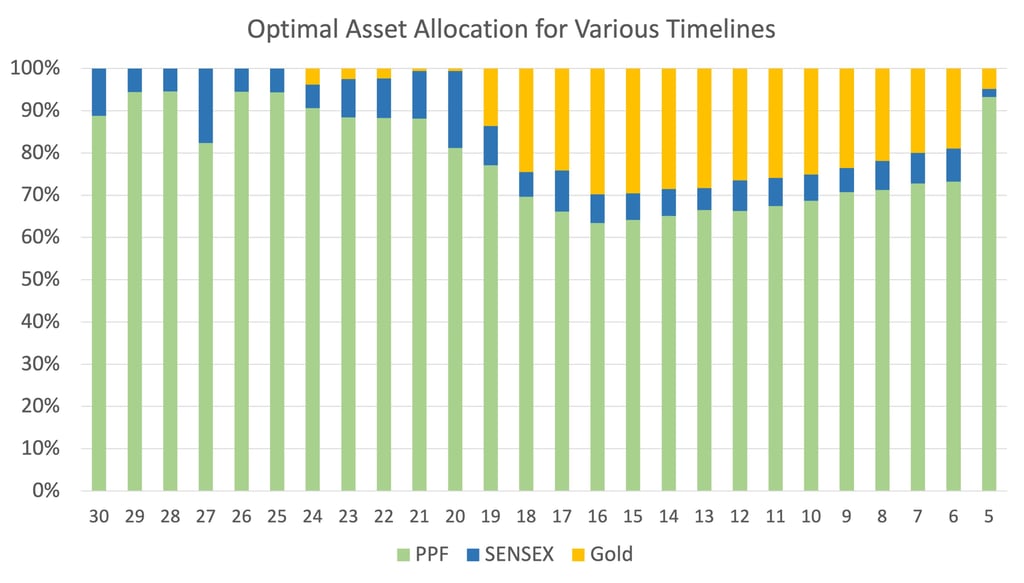
Fig.1
In Part - I of this analysis we covered 6 different asset allocation combos of SENSEX, Gold and PPF. The retirement timeline was 30 years and the Withdrawal Rate was 4%. In terms of Asset Allocation we simplified the allocations to single asset and dual asset 50-50 combos.We concluded that dual asset allocation gives us better outcomes compared to single asset exposure.
In this post we will explore optimal asset allocation for various tenures. What I did was to try different asset allocation combinations between PPF, SENSEX and Gold to find the Max Withdrawal Rate possible for a given tenure e.g. 30 years, without running out of money before tenure completion. I did this for a range of durations (5 - 30 years). As expected Withdrawal Rates shrink as timeframe expands. It also gives us a view of variations in asset allocation between the 3 asset classes for various timeframes.
Refer to Fig 1. (Top) for asset allocations for different timeframes. Table 1. below provides the numerical split and also the Max Withdrawal Rate for each tenure.
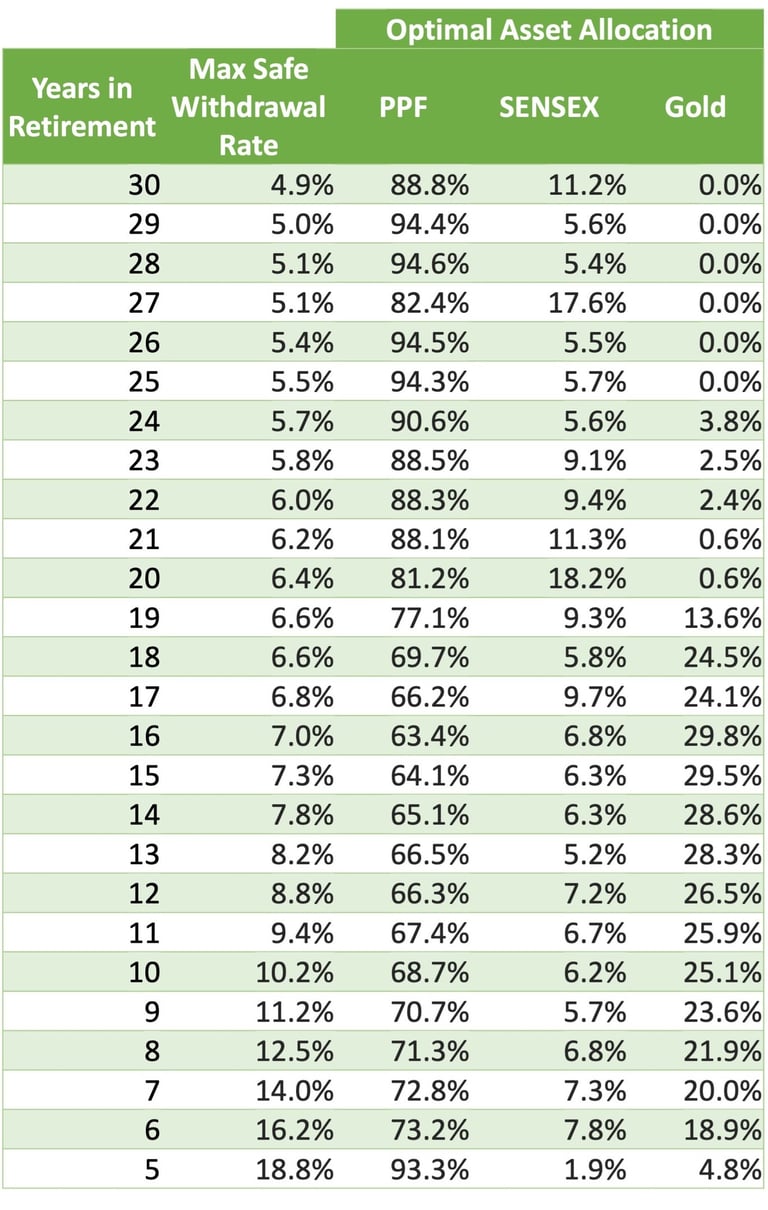
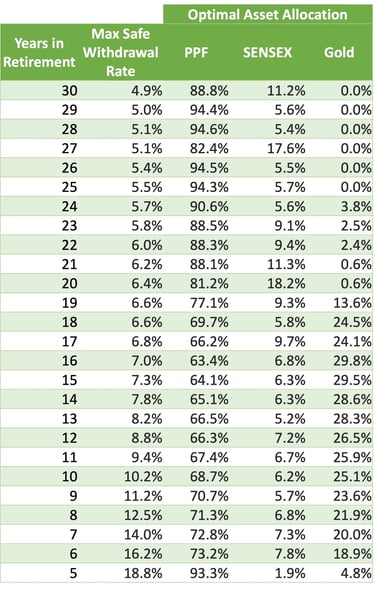
Table 1.
What we observe is that PPF plays an outsized role across all tenures, whether long or short. Proportion of PPF ranges from 65% to 95%.
What surprised me was SENSEX allocation across the spectrum. 2%-18% is a very low range and it stays below 10 for most periods, a median of merely 6.7%. It just goes on to reaffirm that highly volatile asset classes are poor picks for retirement planning.
Gold was an enigma. For long durations 20-30 years it hardly gets any allocation but between 6-19 it outflanks SENSEX. To try and understand why gold is getting such high allocation, I checked correlation between the 3 asset classes for different timeframes 10, 15, 20 and 30 years (Fig.2) on a rolling returns basis. I found that the correlation between gold and PPF was way more negative than between SENSEX and PPF. Negative correlation implies that when price of one asset goes up, the other goes down and vice versa. For 20 years retirement paths, the last viable retirement path is May-'04 to May '24. For all the 20-30 year paths, PPF stayed high 8-12%. But as the horizon shortens to 15-10 years we start seeing paths with much lower PPF. That and the fact that gold took off around mid 2000 are the reasons why we are a see smattering of gold for the lower time frames. Overall, Gold seem to be playing a great balancing act between PPF and Sensex.
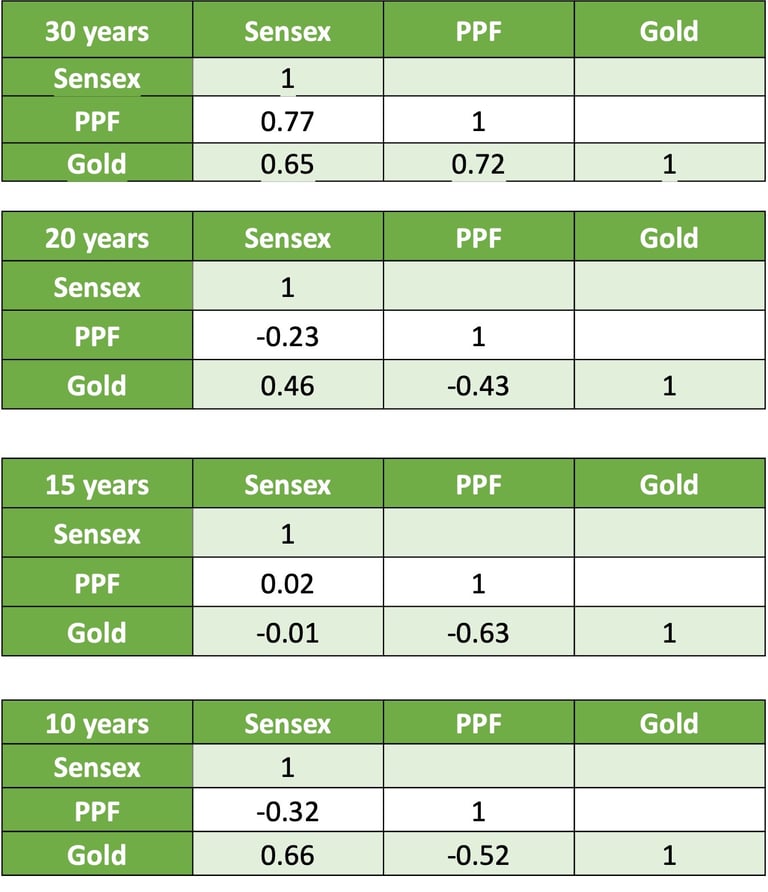
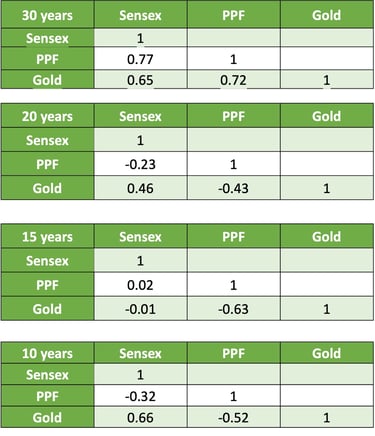
Fig 2. Correlation between SENSEX, PPF and Gold rolling returns of 10, 15, 20 and 30 years
Leaning on PPF, 80% PPF with 10% of SENSEX and 10% Gold looks like an a workable allocation across longer tenures. Refer to Table 2. for comparison between 80% PPF-10% SENSEX-10% Gold combo vs Optimised Withdrawal Rates for various timeframes.
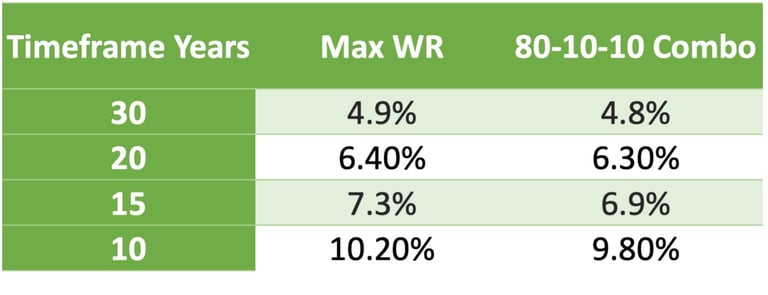
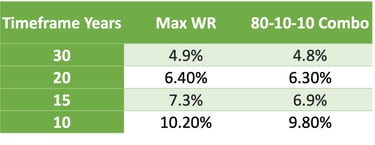
Table 2
As we can see the Max Withdrawal Rate does not vary significantly by moving to 80-10-10 combo. For 30 years the difference in Max WR comes down from 4.89% to 4.81% suggesting we can live with the combo for a 30 year timeframe. Analysis bears out what we surmised earlier, Retirement Planning requires us to manage Ms. Volatility by limiting our exposure to Equities and Gold. Also, unlike part - 1 Gold outshines SENSEX for mid timeframes.
Disclaimer : I'm NOT a SEBI Registered Investment Advisor or Analyst. All content on this website is for educational purpose only. Consult your financial advisor before making any financial decision including investing.